
Page 64 - 2023-ORing_Guidebook-ok(電子書轉檔用)
P. 64
Visualized Management
Technology Description
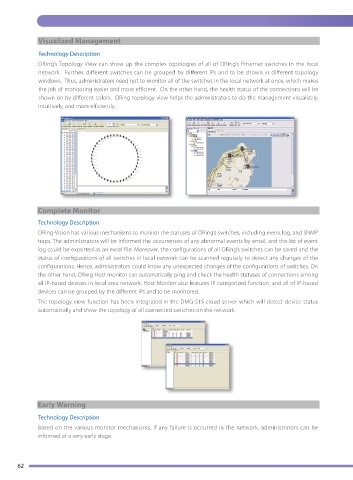
ORing’s Topology View can show up the complex topologies of all of ORing’s Ethernet switches in the local
network. Further, different switches can be grouped by different IPs and to be shown in different topology
windows. Thus, administrators need not to monitor all of the switches in the local network at once, which makes
the job of monitoring easier and more efficient. On the other hand, the health status of the connections will be
shown on by different colors. ORing topology view helps the administrators to do the management visualizely,
intuitively, and more efficiently.
Complete Monitor
Technology Description
ORing-Vision has various mechanisms to monitor the statuses of ORing’s switches, including event log, and SNMP
traps. The administrators will be informed the occurrences of any abnormal events by email, and the list of event
log could be exported as an excel file. Moreover, the configurations of all ORing’s switches can be saved and the
status of configurations of all switches in local network can be scanned regularly to detect any changes of the
configurations. Hence, administrators could know any unexpected changes of the configurations of switches. On
the other hand, ORing Host monitor can automatically ping and check the health statuses of connections among
all IP-based devices in local area network. Host Monitor also features IP categorized function, and all of IP-based
devices can be grouped by the different IPs and to be monitored.
The topology view function has been integrated in the DMG-S15 cloud server which will detect device status
automatically and show the topology of all connected switches on the network.
Early Warning
Technology Description
Based on the various monitor mechanisms, if any failure is occurred in the network, administrators can be
informed at a very early stage.
62